NoteCaddy creates a large amount of data. One important thing to be able to do is to put this data into context. NoteCaddy note definition analysis is a great way to do this. Using this tool you can find information about how the stats in your database correlate to other important information.
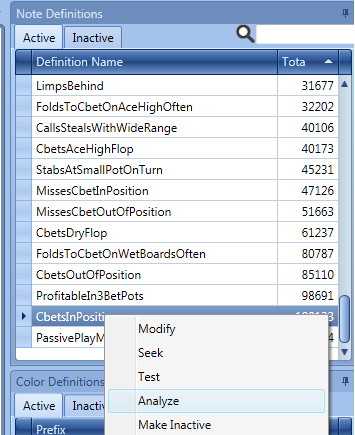
Analysis is only available for note definitions and composite definitions. It is not available for color definitions. The convergence report is only available for note definitionsAnalysis is run by right clicking any definition in the listing and then clicking analyze.
The first thing the analysis screen does is load all the notes for all players. Depending a number of factors like how many hands you have in your database and the strength of your computer hardware, this can take several minutes. Know that if you run Analyze on a second definition, then the initial load will be much faster since the player notes are all already in memory. Analyze is more useful on large databases. Any database with less than 100,000 hands will not likely give information that is adequately reliable.
The Analyze screen contains five reports that will give you a potentially large amount of information. At the top of the screen you see the drop down list of the reports. To the left of that are two very important options.
- Groups - This is essentially the number of bars you want to see in the bar graph. It is how specifically you want the data divided.
- Minimum Opportunities - This is how many opportunities a player needs to have had for the note to be included in the data. By default it is set to 15. Therefore if a player has the note with a 1/1 it is not included. Lowering this number will decrease the quality of the data in the reports. For example, lowering it to 1 will cause the bar for 0 and for 100 to both be very tall. This is bad because it implies that those numbers will be common. While that is true, these numbers would certainly be lower in normalized data. Choosing a higher value here gets you closer to true normalized data.
To the right is the refresh button. This needs to be clicked when you want to show a new report or show the current report with new values.
Percentage Distribution
This will show you how many players perform the action needed for a success over the given interval
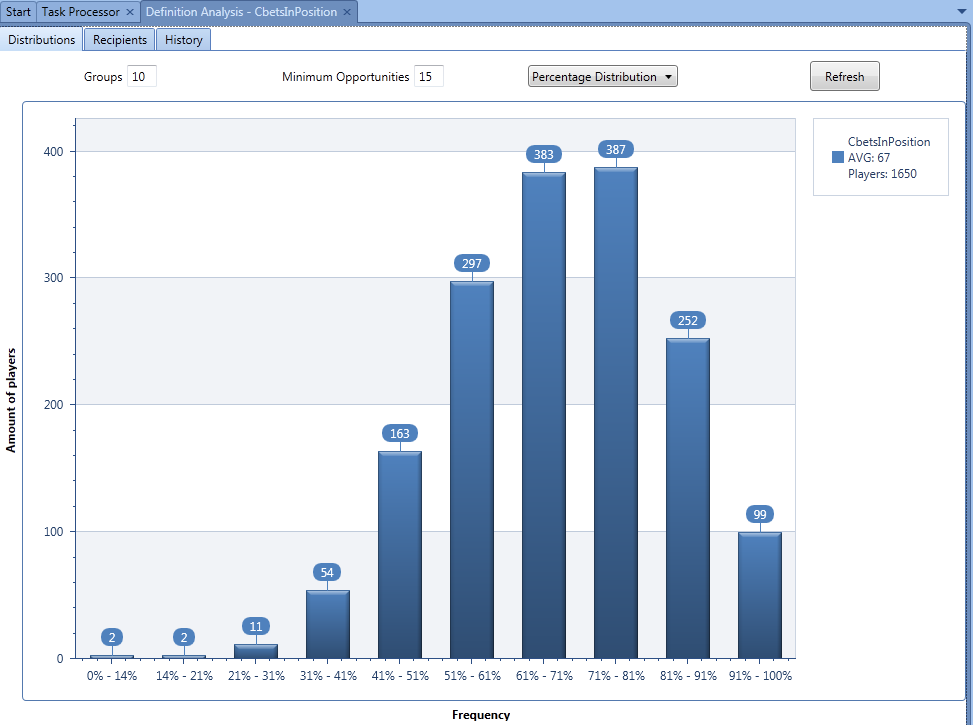
From the above screenshot, we can conclude that few players continuation bet in position under 30% of the time. The curve peaks at around 60-80%. As the value goes above 80, we start to see a decline again. Information like this can be used for a number of purposes. For example, if you only want notes to appear for people outside of the most populous area. Specifically, you can show a badge for people who continuation bet in position under 40% of the time - knowing that this is rare.
Average Player BB/100 by Percent
This report is used to find what percentage winning players perform this action with. This is useful for looking at your own percentage and considering adjustments if you are in a group with a large amount of losing players. This report shows
overall win rate - not just the profitability they exhibited performing this action.
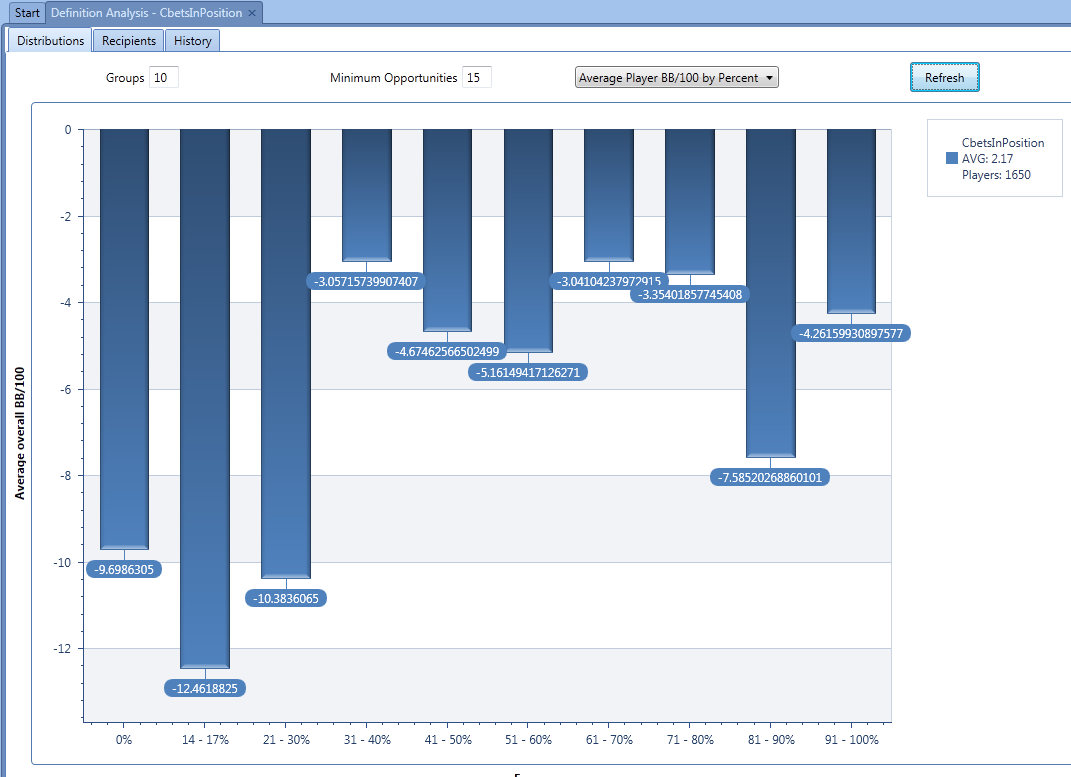
The above image shows two things. First off, the vast majority of players lose money and so all groups are below 0 BB/100 here. Second, the data does not give us a clear picture. Certainly we can see that players who continuation bet in position rarely lose more money than those who do frequently. However, this is obvious.
When a graph doesn't show any consistent curve then we need to try and increase the minimum opportunities until it shows something clearer.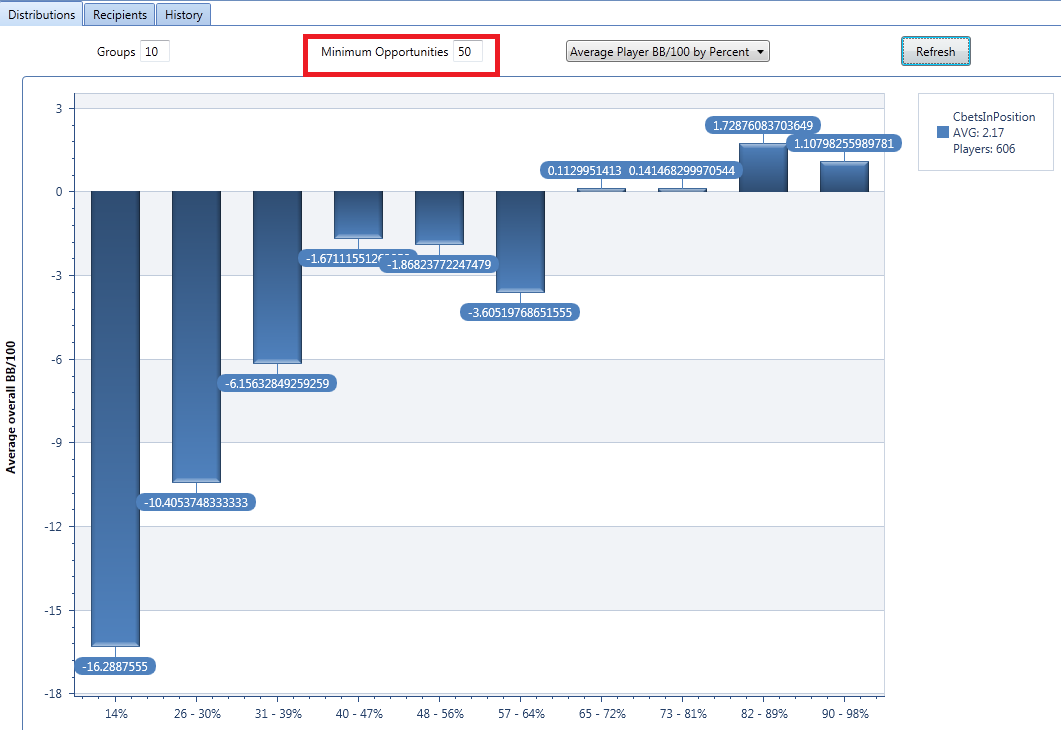
In the above screen shot, the minimum opportunities has been raised to 50 and the shape of the graph changes significantly. Now we can see that winning players over a decent sample size are continuation betting in position 65% of the time or more. The biggest winners seem to do so over 80% of the time. I checked my stats and found that I do this only 59% of the time! It seems that not only an adjustment in order for my own play but this is a great opportunity for a note or badge for players who are out of the optimal range.
Average bb per Instance
This report is a little bit more difficult to understand. It limits the data just to how much was won, on average, when a player continuation bet in position. Keep in mind that the definition being used in these examples is only a single definition and this report is available for any note definition!
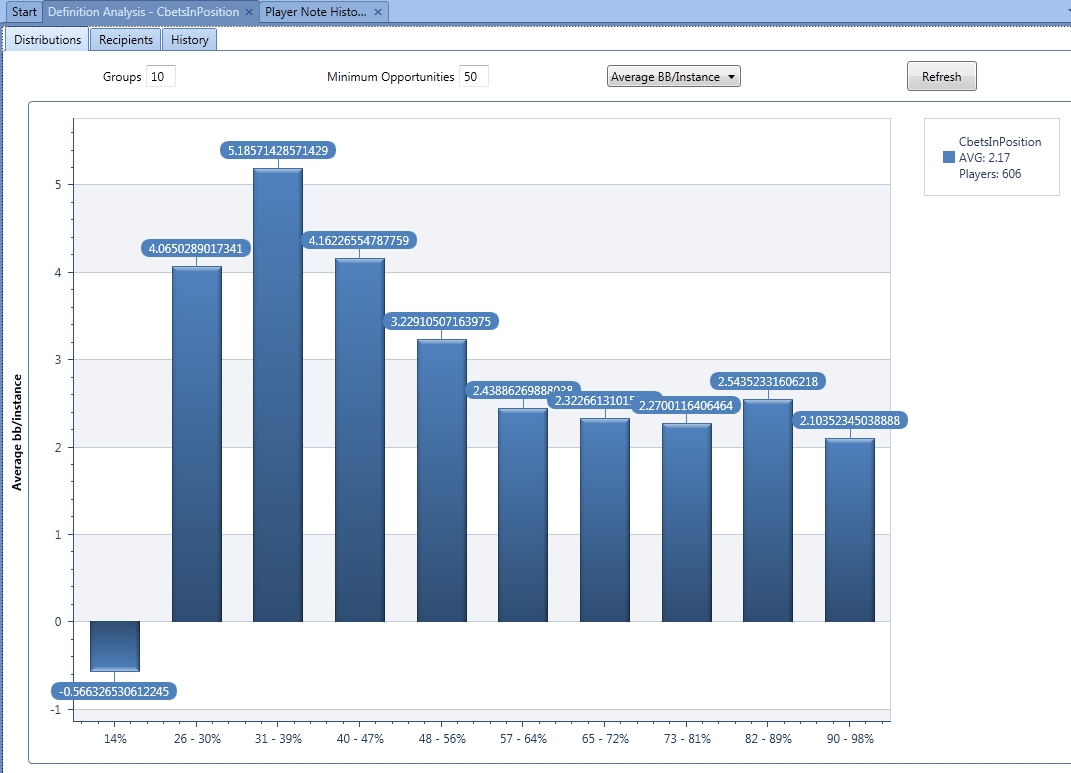
The data on the above screenshot may be somewhat unexpected. Players who continuation bet in position very rarely actually lose money when they do. It seems that players who do this 14% of the time are so bad that they can't win regardless of their hand. Moving along it seems like players who continuation bet in position fairly infrequently actually make more money per instance. This makes sense since they are doing so with stronger hands apparently. Looking at this, it is important to realize that people betting 90% of the time would probably make more money overall since their instances will be much higher. It all needs to be taken in perspective. For example, would you like to earn 5.1 big blinds 30 times (153 total) or 2.1 big blinds 90 times (189 total)?
Average bb per Opportunity
This is similar to the last report except that here we factor in how much money someone makes even when they miss the opportunity. Staying consistent with the example being used here we are factoring in the profitability of checking back rather than continuation betting. The idea of this report is to give us a very clear picture of what is the most profitable frequency with which to perform certain actions. Intuitively, it makes sense that someone who continuation bets in position 90% of the time is going to lose often when he checks back since that implies that he is very weak when he does.
Player Partitions
The goal of this report is to divide players into equal partitions. For example, if you want to color code players based on the VPIP and would like 8 groups with the same amount of players in each, then you would use this report to get ideas.
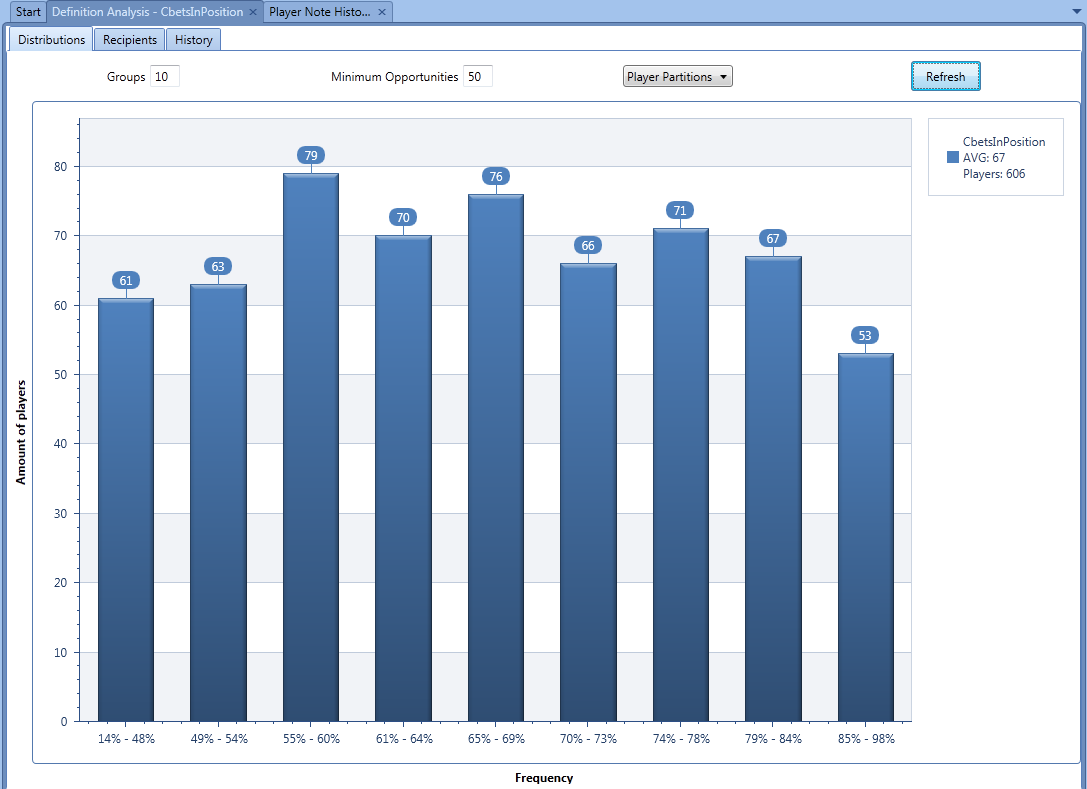
The above image shows that the partitions cannot usually be created exactly equally. The reason is that there may be situations where a large amount of players have the same percentage and dividing them and leaving an overlap would be illogical. In this example, we can conclude that there are quite a few players who continuation bet in position 60% of the time which causes the partition to be larger than others. Overall, this report will give you a fairly clear idea of what the ranges are for percentages of different notes.
Convergence
This report is not available for composite definitionsThe convergence report shows how reliable a stat is based on the number of opportunities. As the X axis gets bigger, the Y axis will basically always shrink until it hits 0. Once the Y axis sits at 0 then the stat is set to have converged. This means the stat is unlikely to change from the current value by even 1 percent. Therefore the stat is 100% reliable. However, the stat doesn't have to completely converge before it is useful.
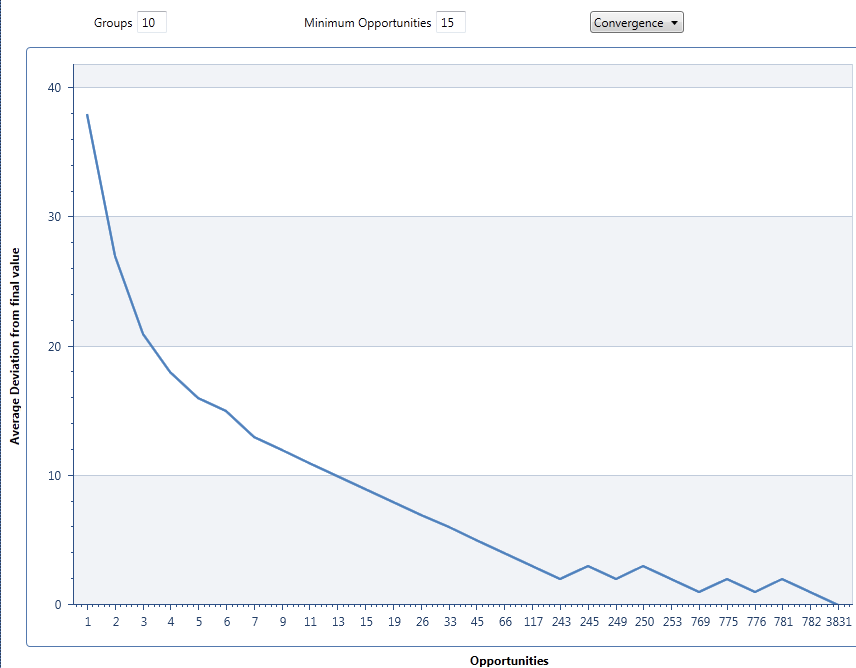
The above screenshot shows the convergence graph for the VPIP stat. As you can see, it doesn't completely converge until 3831 hands. However, at 243 hands, the average difference in someone's VPIP stat from their eventual VPIP is only 2%. This is quite close and arguably can be considered reliable.